Repeating template slides
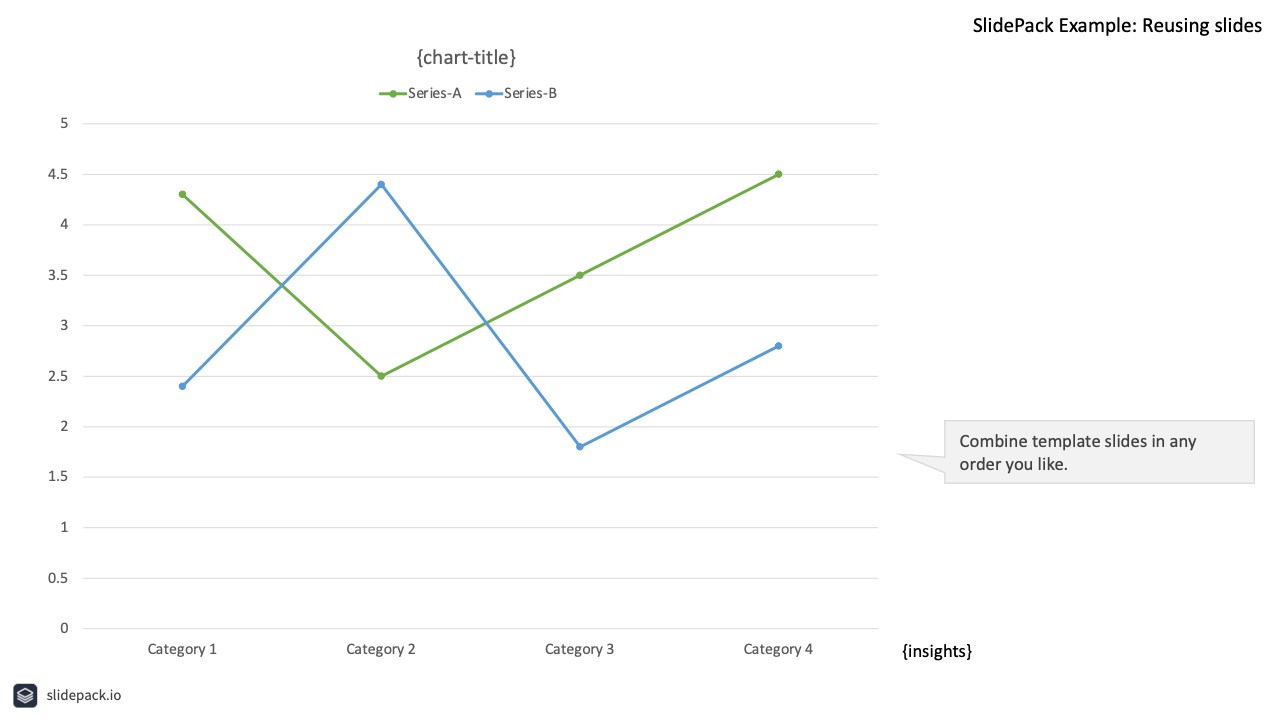
You can repeat a template slide to produce multiple similar slides. Combine template slides in any order you like.
Reference: the root object · the Slide object
Download: input.zip · output.pptx
template.pptx
1
2
output.pptx
1

2
3
4
5
data.json
{
"slides": [
{
"template": 1,
"section-title": "User behavior"
},
{
"template": 2,
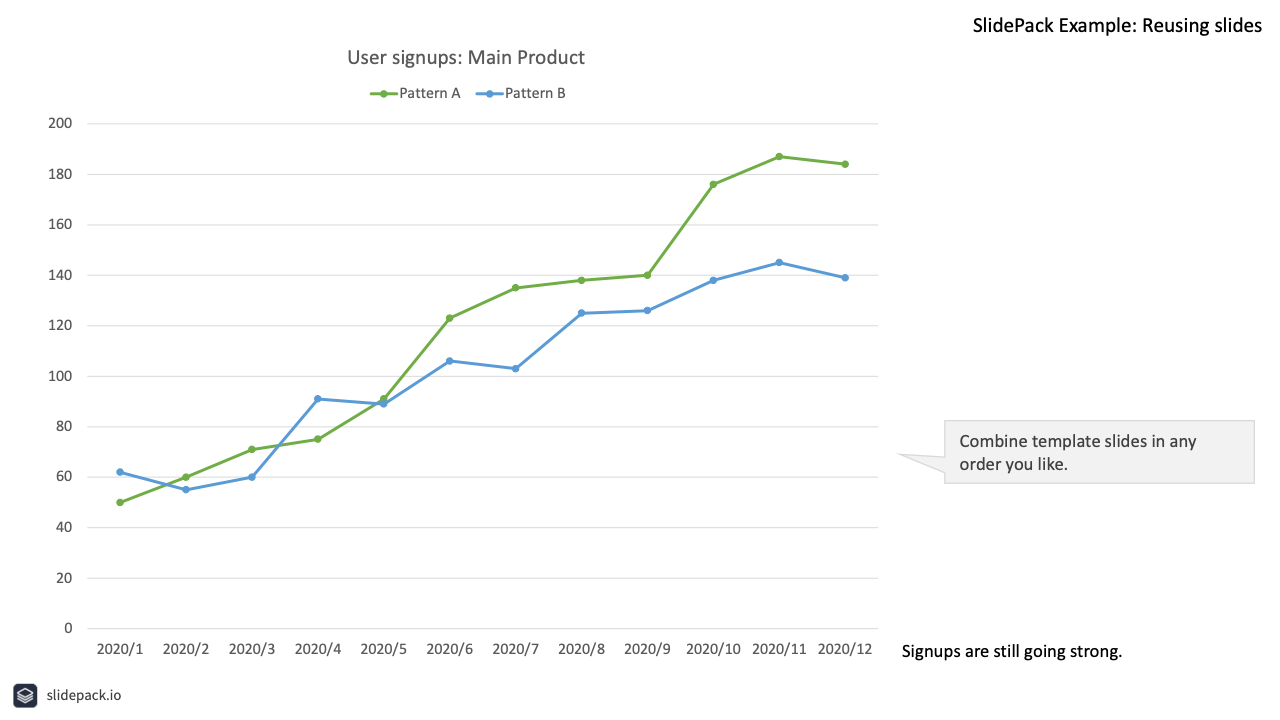
"chart-title": "User signups: Main Product",
"insights": "Signups are still going strong.",
"main-chart": {
"type": "chart",
"labels": [
"2020/1", "2020/2", "2020/3", "2020/4", "2020/5", "2020/6",
"2020/7", "2020/8", "2020/9", "2020/10", "2020/11", "2020/12"
],
"axis1": {
"bounds": { "minimum": 0, "maximum": 200 },
"series": {
"Series-A": {
"name": "Pattern A",
"values": [50, 60, 71, 75, 91, 123, 135, 138, 140, 176, 187, 184]
},
"Series-B": {
"name": "Pattern B",
"values": [62, 55, 60, 91, 89, 106, 103, 125, 126, 138, 145, 139]
}
}
}
}
},
{
"template": 2,
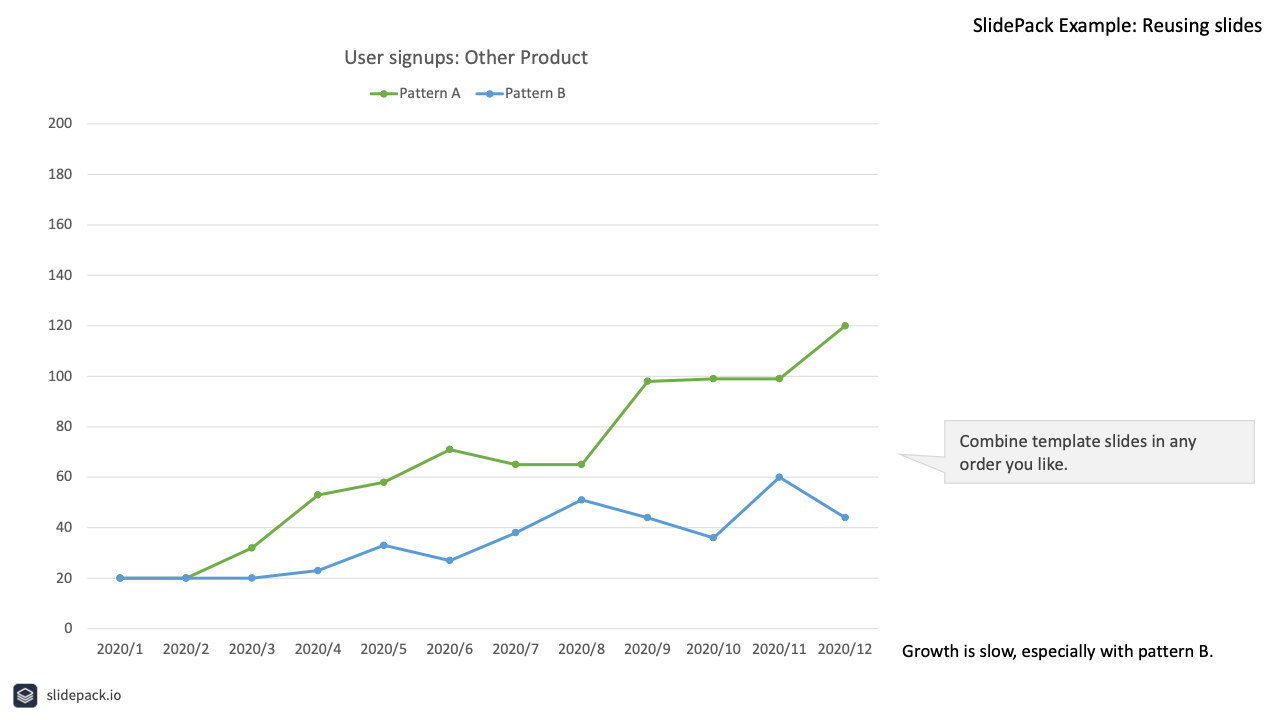
"chart-title": "User signups: Other Product",
"insights": "Growth is slow, especially with pattern B.",
"main-chart": {
"type": "chart",
"labels": [
"2020/1", "2020/2", "2020/3", "2020/4", "2020/5", "2020/6",
"2020/7", "2020/8", "2020/9", "2020/10", "2020/11", "2020/12"
],
"axis1": {
"bounds": { "minimum": 0, "maximum": 200 },
"series": {
"Series-A": {
"name": "Pattern A",
"values": [20, 20, 32, 53, 58, 71, 65, 65, 98, 99, 99, 120]
},
"Series-B": {
"name": "Pattern B",
"values": [20, 20, 20, 23, 33, 27, 38, 51, 44, 36, 60, 44]
}
}
}
}
},
{
"template": 1,
"section-title": "Customer service status report"
},
{
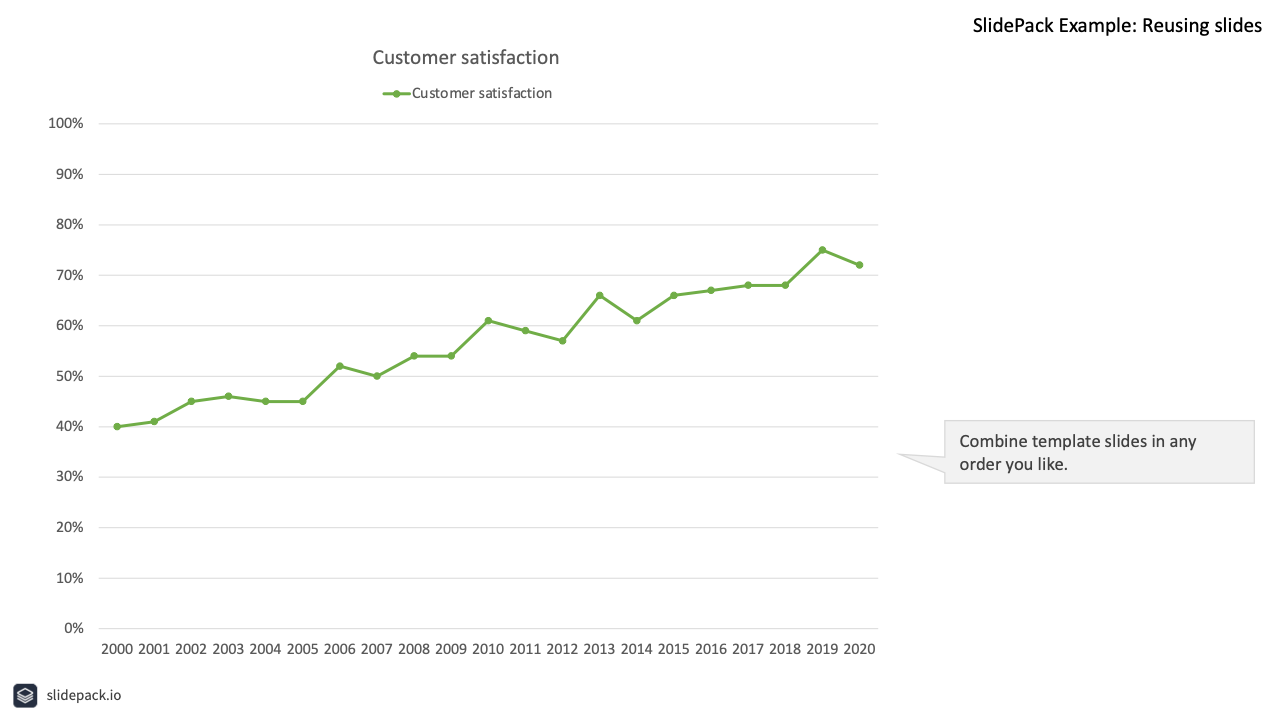
"template": 2,
"chart-title": "Customer satisfaction",
"insights": "",
"main-chart": {
"type": "chart",
"labels": [
"2000", "2001", "2002", "2003", "2004", "2005", "2006", "2007", "2008", "2009",
"2010", "2011", "2012", "2013", "2014", "2015", "2016", "2017", "2018", "2019",
"2020"
],
"axis1": {
"bounds": { "minimum": 0, "maximum": 1 },
"format": "0%",
"series": {
"Series-A": {
"name": "Customer satisfaction",
"values": [
0.4, 0.41, 0.45, 0.46, 0.45, 0.45, 0.52, 0.5, 0.54, 0.54,
0.61, 0.59, 0.57, 0.66, 0.61, 0.66, 0.67, 0.68, 0.68, 0.75,
0.72
]
}
}
}
}
}
]
}