Dynamic chart series
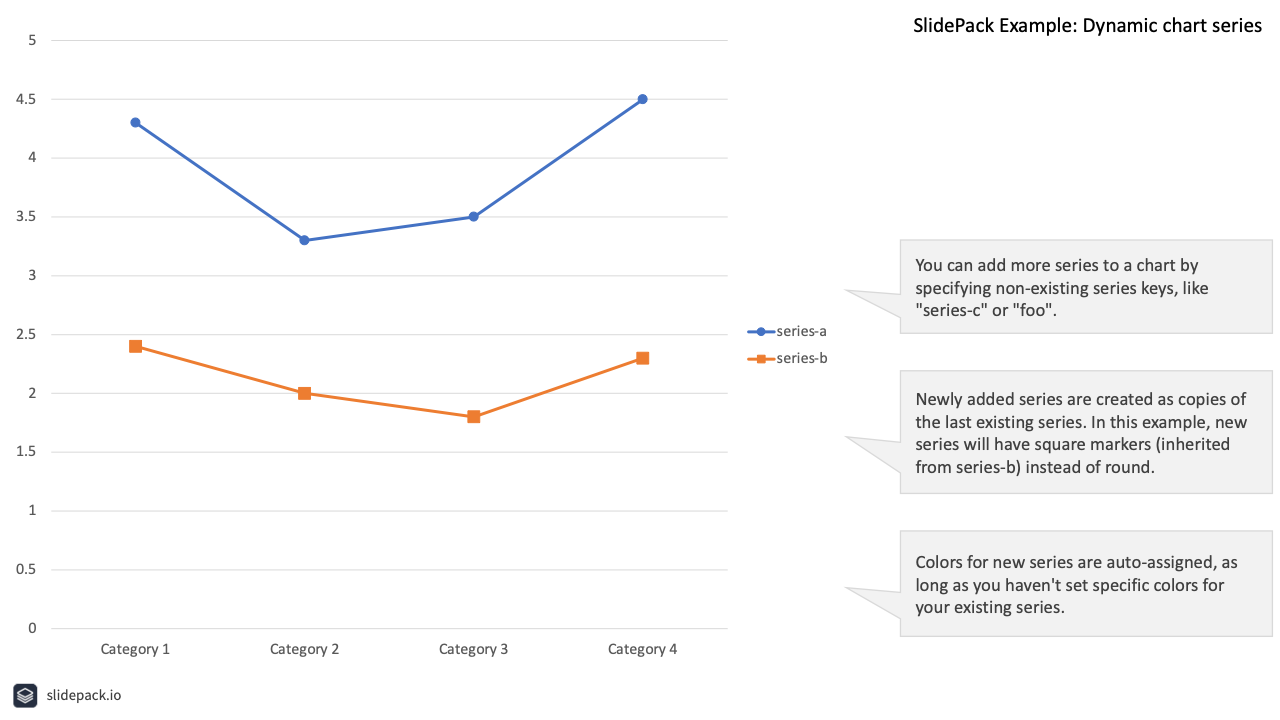
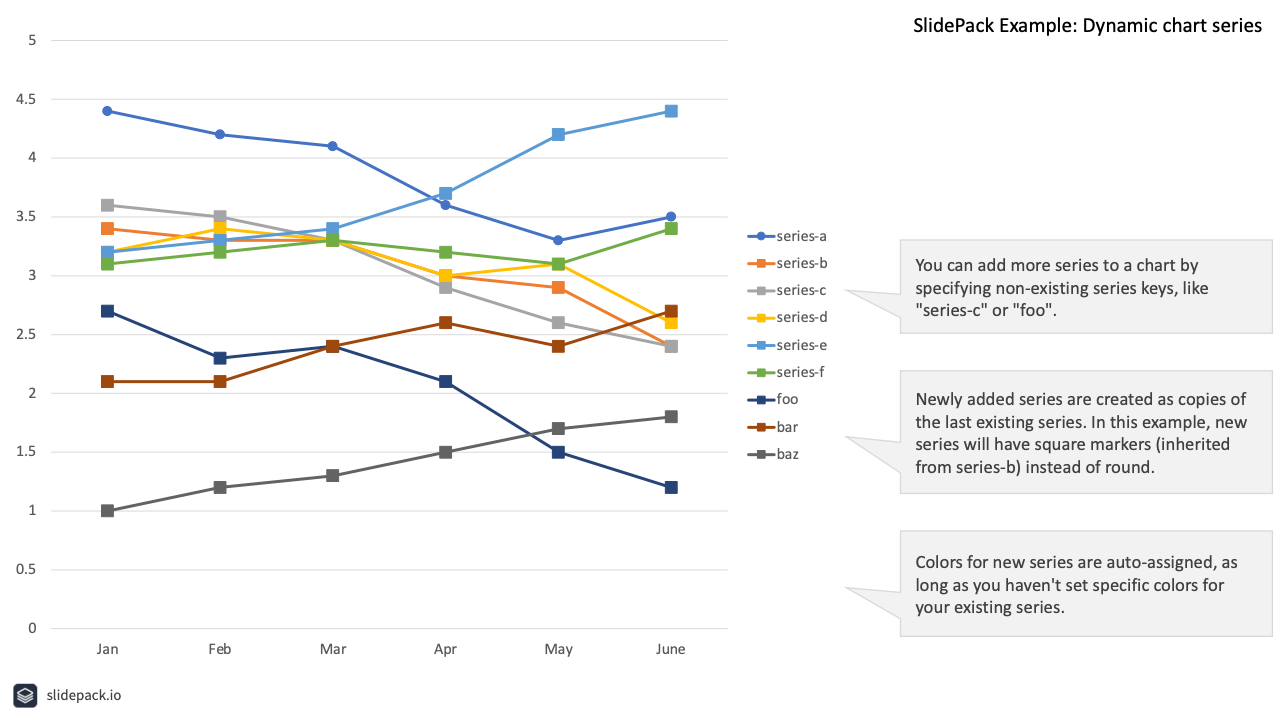
You can add more series to a chart by specifying non-existing series keys.
Newly added series are created as copies of the last existing series.
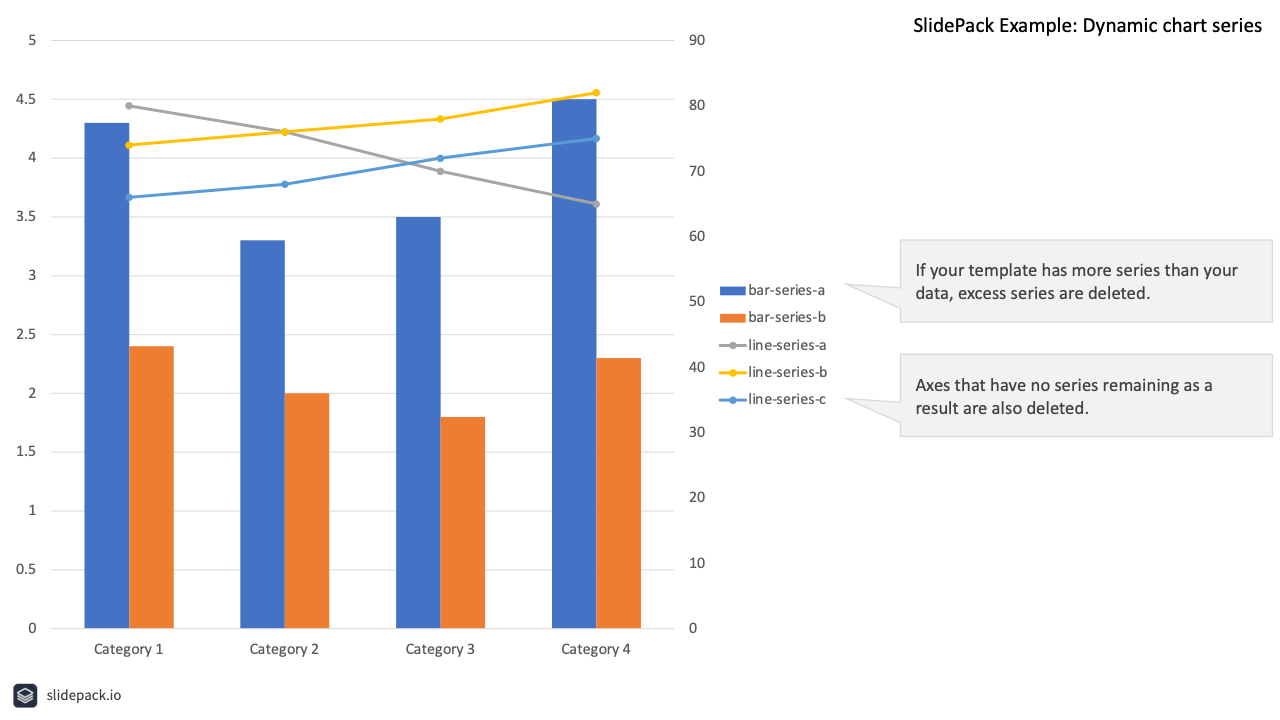
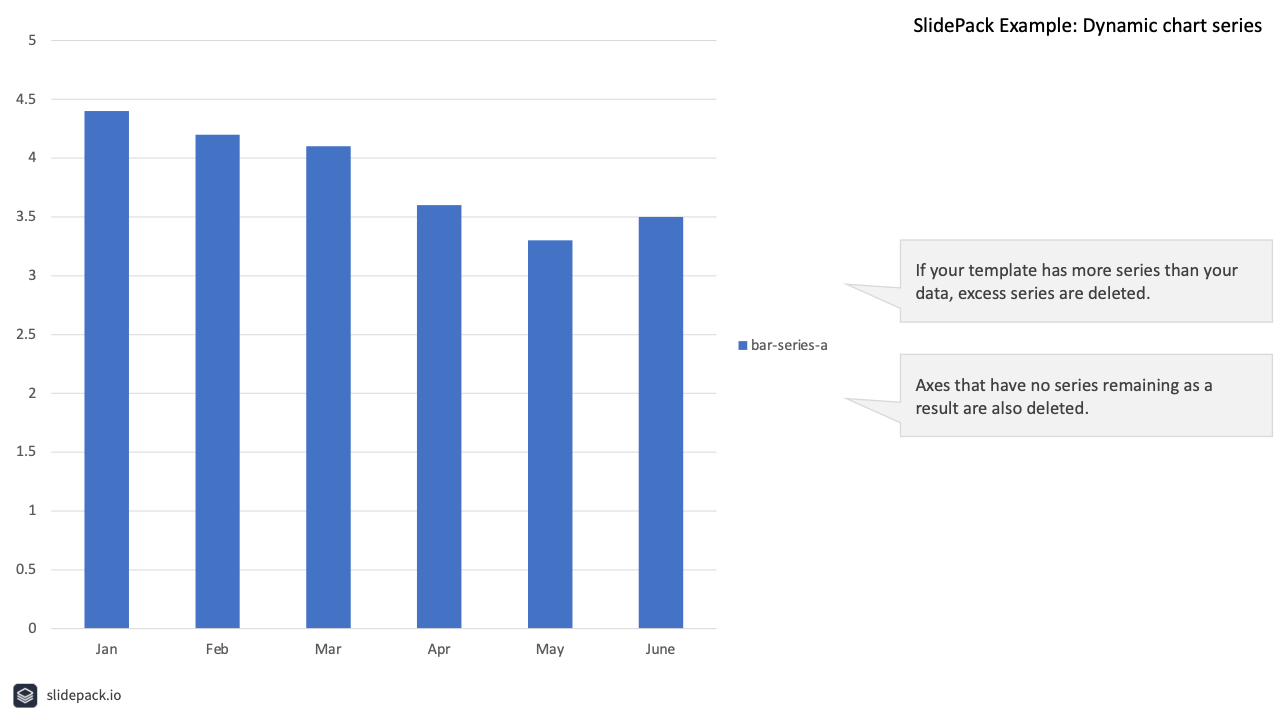
If your template has more series than your data, excess series are deleted. Axes that have no series remaining as a result are also deleted.
Reference: the Chart object · the Scatter Chart object
Download: input.zip · output.pptx
template.pptx
1
2
output.pptx
1
2
data.json
{
  "slides": [
    {
      "template": 1,
      "the-chart": {
        "type": "chart",
        "labels": ["Jan", "Feb", "Mar", "Apr", "May", "June"],
        "axis1": {
          "series": {
            "series-a": {
              "values": [4.4, 4.2, 4.1, 3.6, 3.3, 3.5]
            },
            "series-b": {
              "values": [3.4, 3.3, 3.3, 3, 2.9, 2.4]
            },
            "series-c": {
              "values": [3.6, 3.5, 3.3, 2.9, 2.6, 2.4]
            },
            "series-d": {
              "values": [3.2, 3.4, 3.3, 3, 3.1, 2.6]
            },
            "series-e": {
              "values": [3.2, 3.3, 3.4, 3.7, 4.2, 4.4]
            },
            "series-f": {
              "values": [3.1, 3.2, 3.3, 3.2, 3.1, 3.4]
            },
            "foo": {
              "values": [2.7, 2.3, 2.4, 2.1, 1.5, 1.2]
            },
            "bar": {
              "values": [2.1, 2.1, 2.4, 2.6, 2.4, 2.7]
            },
            "baz": {
              "values": [1, 1.2, 1.3, 1.5, 1.7, 1.8]
            }
          }
        }
      }
    },

    {
      "template": 2,
      "the-chart": {
        "type": "chart",
        "labels": ["Jan", "Feb", "Mar", "Apr", "May", "June"],
        "axis1": {
          "series": {
            "bar-series-a": {
              "values": [4.4, 4.2, 4.1, 3.6, 3.3, 3.5]
            }
          }
        }
      }
    }
  ]
}