Charts
Populate charts with objects containing data.
Currently supported chart types are Bar, Line, Area, Pie and Scatter charts.
(Data format for scatter charts are different from other types of charts.)
SlidePack will look for charts that have the key ("chart1" in this example) as its alt text.
In PowerPoint, right click on a chart and select View alt text to change a chart's alt text.
Reference: the Chart object · the Scatter Chart object
Download: input.zip · output.pptx
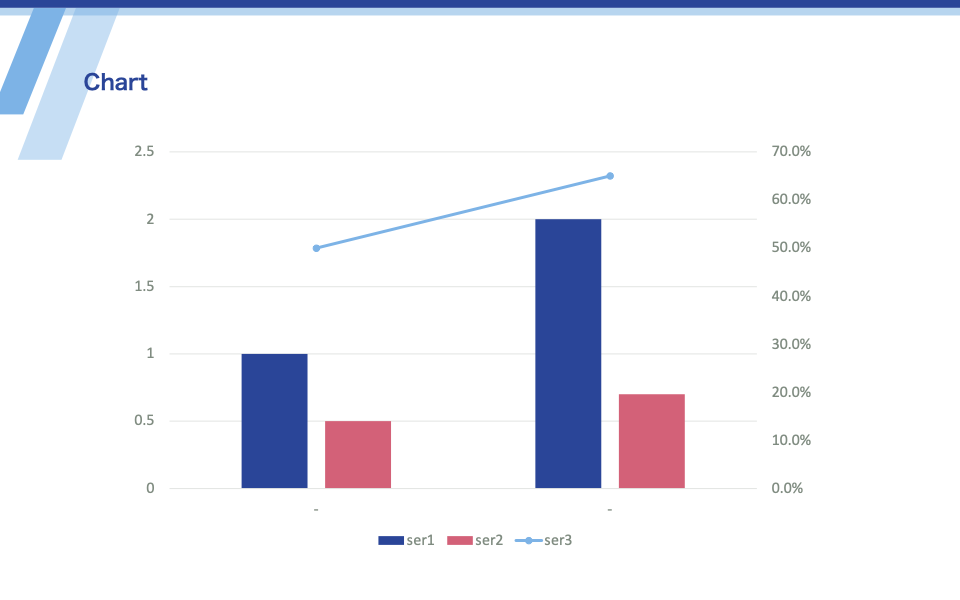
template.pptx
1
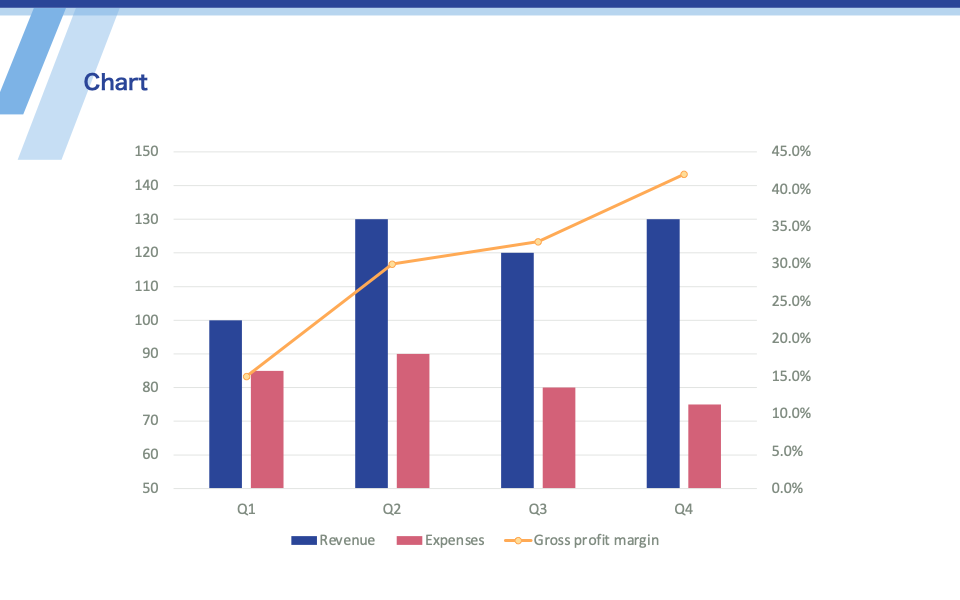
output.pptx
1
data.json
{
  "slides": [
    {
      "template": 1,
      "chart1": {
        "type": "chart",
        "labels": ["Q1", "Q2", "Q3", "Q4"],
        "axis1": {
          "bounds": {
            "minimum": 50,
            "maximum": 150
          },
          "series": {
            "ser1": {
              "name": "Revenue",
              "values": [100, 130, 120, 130]
            },
            "ser2": {
              "name": "Expenses",
              "values": [85, 90, 80, 75]
            }
          }
        },
        "axis2": {
          "series": {
            "ser3": {
              "name": "Gross profit margin",
              "values": [0.15, 0.3, 0.33, 0.42],
              "styles": {
                "shape": { "fill": "ffdd99", "outline": "ffaa55" }
              }
            }
          }
        }
      }
    }
  ]
}