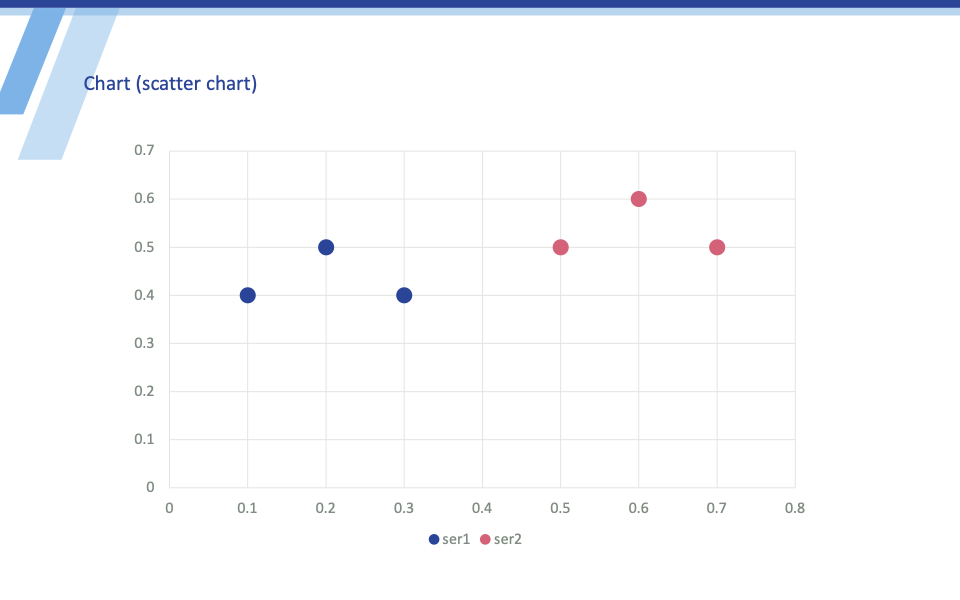
Scatter charts
Populate scatter charts with objects containing data.
SlidePack will look for charts that have the key ("chart1" in this example) as its alt text.
In PowerPoint, right click on a chart and select View alt text to change a chart's alt text.
Reference: the Scatter Chart object
Download: input.zip · output.pptx
template.pptx
1
output.pptx
1
data.json
{
"slides": [
{
"template": 1,
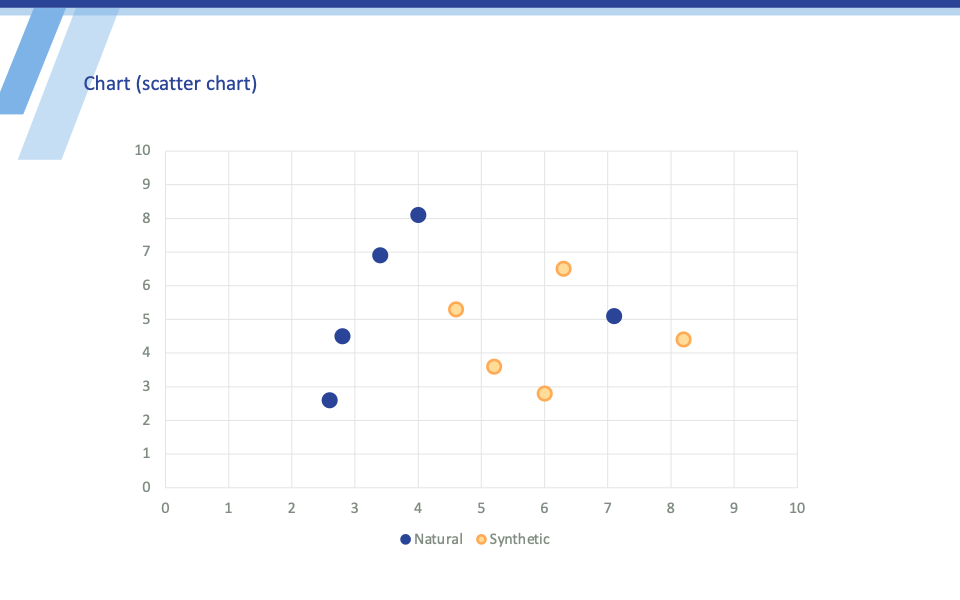
"scatter1": {
"type": "scatter-chart",
"axis1": {
"x_bounds": { "minimum": 0, "maximum": 10 },
"y_bounds": { "minimum": 0, "maximum": 10 },
"series": {
"ser1": {
"name": "Natural",
"values": [
[7.1, 5.1],
[3.4, 6.9],
[2.6, 2.6],
[4.0, 8.1],
[2.8, 4.5]
]
},
"ser2": {
"name": "Synthetic",
"values": [
[4.6, 5.3],
[5.2, 3.6],
[6.0, 2.8],
[6.3, 6.5],
[8.2, 4.4]
],
"styles": {
"shape": { "fill": "ffdd99", "outline": "ffaa55" }
}
}
}
}
}
}
]
}